Benefits of Excel Dashboard Automation for Businesses
Businesses handle large amounts of reporting data every day. Manual Excel reporting can be repetitive, time-consuming, and prone to errors. Excel dashboard automation helps businesses simplify reporting processes, automate KPI tracking, and improve decision-making using dynamic dashboards and automated reports.
What is automated Excel reporting?
Excel dashboard automation is the process of automating reports, charts, KPIs, and business dashboards in Microsoft Excel using formulas, Power Query, Pivot Tables, VBA, and connected data sources.
Why Businesses Need Excel reporting dashboards
Many companies still use manual Excel sheets for daily and weekly reporting. Teams spend hours updating reports, copying data, and creating charts manually. Excel dashboard automation eliminates repetitive tasks and helps businesses access reporting insights faster.
Key Benefits of Excel reporting dashboards
- Saves reporting time
- Reduces manual errors
- Improves KPI tracking
- Better business decisions
- Centralized reporting
Features of Automated Excel Dashboards
Excel dashboard automation is transforming the way businesses manage reporting and analytics. Many companies still rely on manual Excel sheets for preparing reports, updating KPIs, and sharing business insights. This process is often time-consuming, repetitive, and prone to human errors. Excel dashboard automation helps businesses simplify reporting workflows, reduce manual work, and improve decision-making using automated reporting systems.
Excel dashboard automation is the process of automating reports, charts, KPIs, and business dashboards in Microsoft Excel using formulas, Pivot Tables, Power Query, VBA, and connected data sources. Instead of manually updating reports every day, businesses can create automated dashboards that refresh data automatically and display real-time business insights.
Businesses across finance, sales, HR, operations, and inventory management use automated Excel dashboards to monitor performance and improve reporting accuracy. Automated dashboards help management teams track important business metrics, analyze trends, and generate reports much faster compared to traditional reporting methods.
One of the biggest benefits of Excel dashboard automation is time-saving. Teams no longer need to spend hours updating spreadsheets, copying data, or preparing charts manually. Automated dashboards reduce repetitive tasks and help employees focus on analysis and business growth instead of manual reporting work.
Excel dashboard automation also helps reduce reporting errors. Manual reporting often creates issues such as incorrect formulas, missing data, or inconsistent reports. Automated reporting systems improve data accuracy and provide more reliable business insights for management teams.
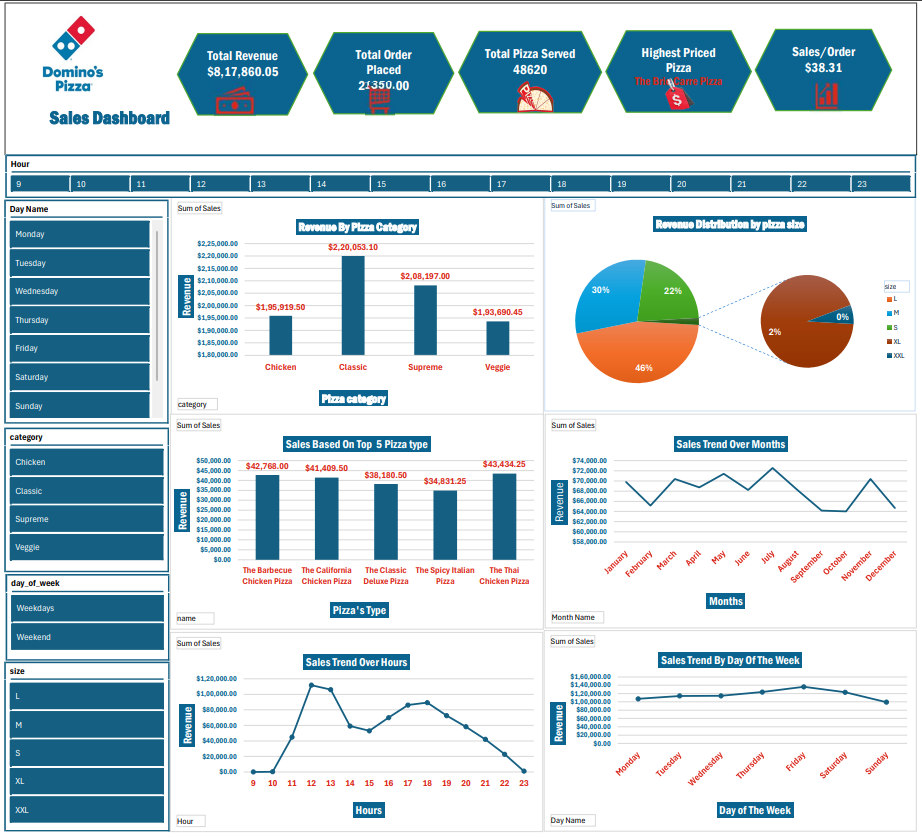
Modern automated Excel dashboards include features such as interactive charts, KPI cards, slicers, Pivot Tables, conditional formatting, and automated data refresh systems. Businesses can create centralized reporting dashboards that combine multiple data sources into a single reporting view.
Automated Excel reporting is also useful for KPI tracking and performance monitoring. Management teams can easily monitor sales performance, operational efficiency, financial reports, employee productivity, and customer trends using dynamic dashboards.
Many businesses also combine Excel dashboard automation with Power BI dashboards and cloud-based reporting systems to create scalable analytics solutions. This helps organizations improve business visibility and make faster data-driven decisions.
Excel dashboard automation also improves reporting standardization across organizations. Many businesses face challenges where different departments maintain separate Excel files with inconsistent formats and reporting structures. Automated dashboards help create a unified reporting framework that improves consistency and data visibility across teams.
Another major advantage of Excel dashboard automation is faster access to business insights. Management teams can quickly analyze sales trends, financial performance, operational KPIs, and employee productivity without waiting for manually prepared reports. Real-time reporting dashboards allow businesses to respond faster to market changes and operational challenges.
Excel dashboard automation is especially valuable for small and medium-sized businesses that rely heavily on Excel-based reporting systems. Instead of investing in expensive enterprise software initially, businesses can automate their reporting workflows using advanced Excel dashboards combined with Power Query and automated data connections.
Automated Excel dashboards also improve collaboration between teams by creating centralized reporting systems that can be shared across departments. Teams can monitor common KPIs, track business goals, and access updated reports from a single dashboard environment.
Businesses using Excel dashboard automation often experience improved productivity because employees spend less time preparing reports manually. Automated systems reduce repetitive work and help organizations focus more on strategy, analysis, and business growth initiatives.
Another important benefit of Excel dashboard automation is scalability. As businesses grow, reporting requirements also increase. Automated Excel dashboards help organizations manage larger datasets and more complex reporting structures without significantly increasing manual workload. Businesses can create scalable reporting systems that support long-term operational growth.
Excel dashboard automation can also integrate with external databases, cloud storage platforms, CRM systems, ERP software, and APIs. This allows businesses to create dynamic reporting environments where data updates automatically from multiple business systems into one centralized dashboard.
Interactive dashboards improve user experience by allowing management teams to filter data, analyze trends, and customize reports according to business requirements. Features like slicers, drill-through analysis, and dynamic charts help users gain deeper insights from business data.
At Zentrx, we help businesses automate Excel reporting processes, build interactive dashboards, and simplify reporting workflows using advanced Excel automation solutions. Our solutions are designed to improve KPI tracking, reduce reporting delays, and create efficient reporting systems for modern businesses.
Excel dashboard automation is becoming essential for businesses looking to improve reporting efficiency, reduce manual work, and build smarter reporting systems. Automated dashboards help companies save time, improve reporting accuracy, and make better business decisions using real-time analytics and reporting insights.
Why Choose Zentrx for automated Excel reporting?
Zentrx helps businesses automate Excel reporting processes, build interactive dashboards, and improve KPI tracking using advanced Excel automation solutions.
Conclusion
Excel dashboard automation is becoming essential for modern businesses that want faster reporting and better decision-making. Automated Excel dashboards help reduce manual work, improve KPI visibility, and simplify business reporting processes across multiple departments.
Explore our Power BI Dashboard Services.
Learn more about our MIS Reporting solutions.
Contact our team for Excel dashboard automation services and business intelligence solutions.