Related Data Analytics Resources
Explore how modern organizations use dashboards, reporting automation, and data visualization solutions to improve decision-making and business performance.
Explore our : Dashboard Development Services , Business Intelligence Consulting Services
How Our Data Visualization Services Help Businesses Grow
Every growing business collects data from multiple sources including customer transactions, sales pipelines, financial systems, digital marketing campaigns, internal operations, and employee performance tracking. While organizations have more data available than ever before, the real challenge lies in understanding that information quickly and turning it into decisions that create measurable business growth.
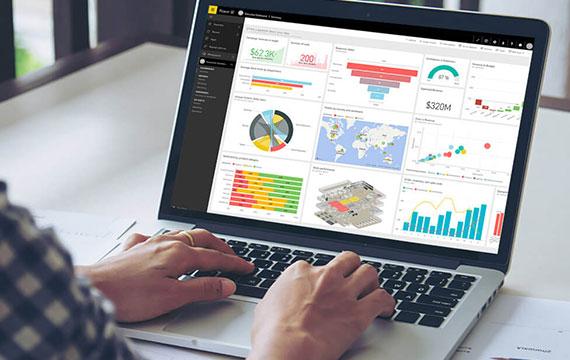
This is where Data Visualization Services play a critical role in helping organizations simplify complex information and create a structured decision-making process. Instead of working with static spreadsheets or manually prepared reports, businesses can use visual dashboards that organize important data into meaningful charts, performance indicators, and real-time reporting systems.
At Zentrx, we help businesses design customized Data Visualization Services that improve reporting efficiency and create better visibility into day-to-day operations. Our approach focuses on understanding how data moves within an organization and identifying the most important metrics that leadership teams need for making strategic decisions.
One of the major challenges businesses face is delayed reporting. In many organizations, employees spend hours collecting data from different software systems, manually preparing reports, validating numbers, and sharing updates across teams. This process creates unnecessary operational delays and often increases the chances of reporting inconsistencies. Through automated reporting dashboards and centralized reporting systems, businesses can reduce dependency on manual reporting processes and access information instantly whenever required.
Effective Data Visualization Services allow organizations to monitor business performance continuously instead of waiting for weekly or monthly reporting cycles. Sales teams can monitor revenue performance, finance departments can track cash flow and expense patterns, marketing teams can measure campaign performance, and management teams can access executive dashboards that provide a complete business overview from a single reporting interface.
Another important advantage of visual analytics is faster identification of business trends. Raw spreadsheets often hide patterns that are difficult to identify during manual analysis. Interactive dashboards help organizations visualize changes in customer behavior, revenue fluctuations, operational bottlenecks, and performance trends that may directly impact business growth. This allows companies to respond faster and make proactive decisions instead of reacting after problems become larger.
Our Data Visualization Services include dashboard development, KPI monitoring systems, executive reporting solutions, automated reporting workflows, and custom business intelligence reporting frameworks designed specifically around business requirements. We build scalable solutions using technologies such as Power BI, Tableau, SQL databases, Excel reporting automation, cloud reporting platforms, and modern analytics infrastructure that help organizations centralize reporting systems.
As businesses continue moving toward data-driven operations, having clear and accessible reporting systems is no longer optional. Companies that rely on visual analytics gain a significant advantage because decision-makers spend less time understanding reports and more time acting on opportunities that improve business performance.
At Zentrx, our goal is to help organizations build reporting systems that convert raw business data into clear business intelligence. Through professional Data Visualization Services, we enable businesses to improve operational transparency, track critical performance metrics in real time, and create reporting solutions that support long-term scalability.
Whether an organization needs executive dashboards, sales reporting systems, operational monitoring dashboards, or automated business reporting infrastructure, investing in modern Data Visualization Services creates a stronger foundation for smarter decisions, better reporting accuracy, and sustainable business growth in an increasingly data-driven world.